pyramid2 v32 Results Charts

Four-layer adaptive evaluation on three held-out kitchen tasks (h3 / h4 / h5, HD-EPIC). Solver: Gemini 4. Examiner and judge: Gemini 3.1 Pro. The same h4 items were also replayed with Qwen3.5-35B-A3B. All runs on 2026-11-05.

Every item is first answered blind (no clip, no goal); a correct blind answer voids it Pass rate = correct ÷ (correct + wrong), scored items only Mastery = mean over skills of the staircase boundary mapped to 0–1 Data and notes (HuggingFace)
Figure 1

Mastery and pass rate by layer, per task
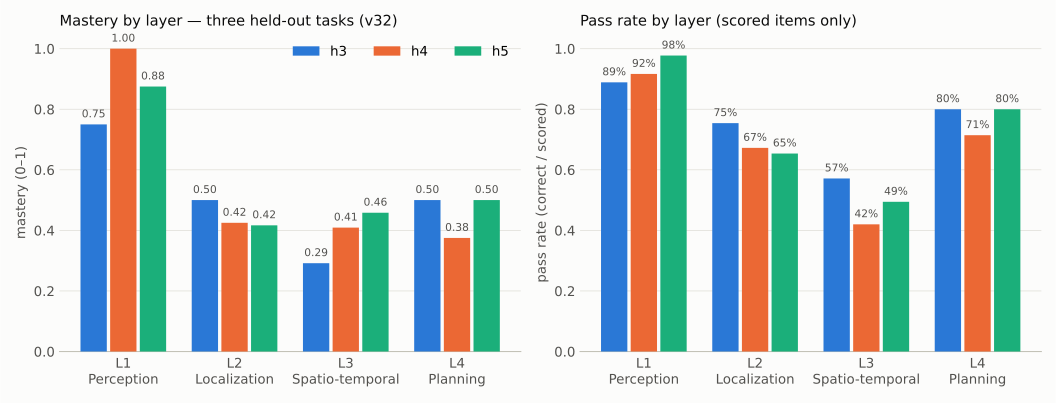
Two grouped bar charts: mastery (left) and pass rate (right) of h3, h4 and h5 at L1 to L4. On every task L1 is highest, L2 next, L3 lowest, and L4 rises again.
L1 → L2 → L3 falls monotonically on every task, on both metrics. L4 (gap-filling over hidden sub-goals) has only 5–7 scored items per task and does not sit on the same curve.
Figure 2

Before and after the fixes: v32 (h3+h4+h5) vs v30b (61+62+63)
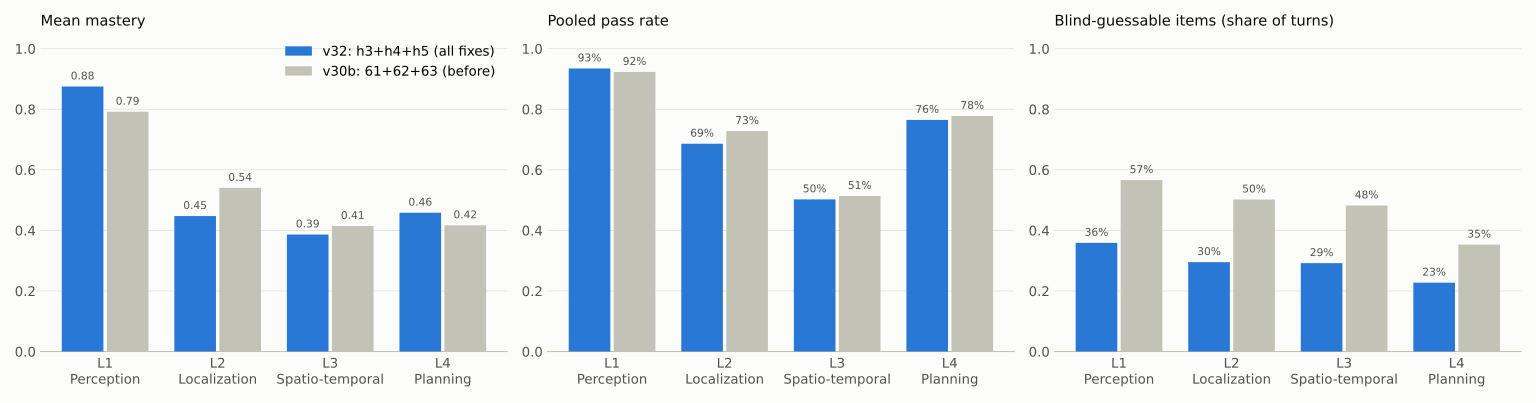
Three grouped bar charts: mean mastery, pooled pass rate and the share of blind-guessable turns, blue for v32 and gray for v30b.
The layer ordering is unchanged. Blind-guessable waste fell from 48–57% of turns per layer to 23–36% (program-filled and shuffled options, one retry instead of two). L2 carries the history-timestamp leak in both configurations; see Figure 4.
Figure 3

L3 pass rate per skill, three tasks pooled
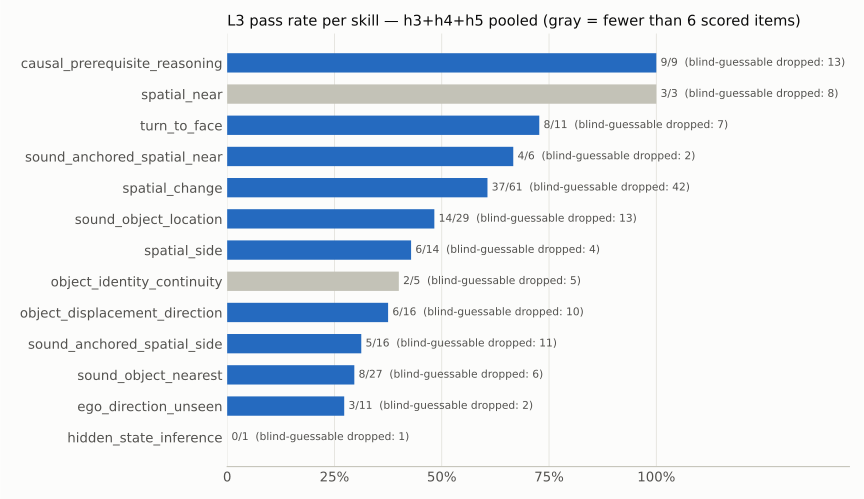
Ranked horizontal bars: pass rate of the 13 L3 skills with correct/scored counts and the number of voided items; gray bars have fewer than 6 scored items.
The hardest skills are the two chained ones (sound_object_nearest, 30%) and egocentric direction (ego_direction_unseen, 27%). causal_prerequisite_reasoning is 9/9 with 13 items voided as blind-guessable: the current item type does not measure it.
Figure 4

Same items, second solver: Gemini 4 vs Qwen3.5-35B-A3B (h4)
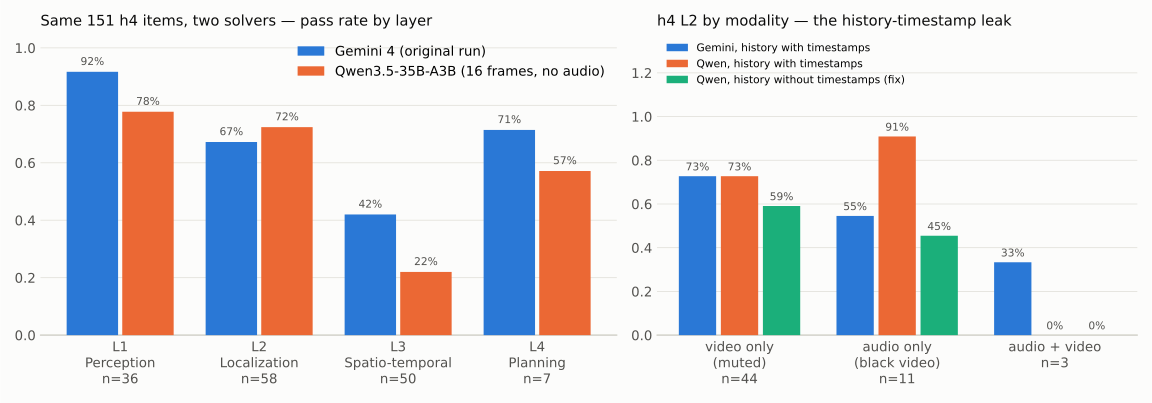
Left: pass rate by layer of both solvers on the 151 scored h4 items. Right: L2 split by modality, with Qwen results using history with and without timestamps.
Both models show the same pyramid shape; the gap is widest at L3 (42% vs 22%). The right panel exposes a leak: Qwen solved 10 of 11 audio-only items with no audio at all, because the L1 facts in the history carried frame times inside the answer span. With timestamps removed it drops to 45%. The code is fixed; the L2 numbers on this page are still the leaked version and are likely 15–20 points too high.
Figure 5

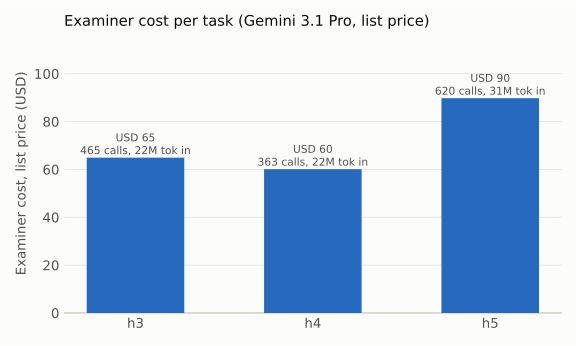
Examiner cost per task

Bar chart of examiner cost at list price for h3, h4 and h5: about 65, 60 and 90 US dollars, annotated with call counts and input tokens.
The examiner accounts for more than 85% of all tokens. Held-out tasks have 13–16 sub-goals and 290–500 turns each, more than twice the size of the earlier tasks 61/62/63.
Table

Metrics by layer

Layerh3 mastery / passh4h5Pooled mastery / passScored itemsBlind-guessable share
L1 Frame Perception0.75 / 89%1.00 / 92%0.88 / 98%0.88 / 93%10736%
L2 Localization × modality0.50 / 75%0.42 / 67%0.42 / 65%0.45 / 69% (leaked)22330%
L3 Spatio-temporal Reasoning0.29 / 57%0.41 / 42%0.46 / 49%0.39 / 50%20929%
L4 Planning (gap-filling)0.50 / 80%0.38 / 71%0.50 / 80%0.46 / 76%1723%

Three things to keep in mind when reading the charts: the L2 numbers include the history-timestamp leak; L4 single-choice items are easy on long tasks (distractors are steps about other ingredients, so the head segment alone identifies the answer); most L3 skills have only 1–16 scored items per task, so most staircase boundaries are estimates rather than converged values.